UK Dog Fouling Statistics 2023
In 2023, Household Pets sent a Freedom of Information (FOI) request to 50 councils across the UK to collect information on dog fouling. The collected data includes the number of complaints, Fixed Penalty Notices (FPNs), and prosecutions each council recorded between the 1st of January 2015 and the 31st of December 2022.
Although the data shows that dog fouling is a prevalent issue in many local authorities nationwide, the three council areas most affected by dog fouling are in Scotland and Northern Ireland.
Methodology
1) The 50 councils were selected by finding the local authorities with the highest populations in the UK. This decision ensured the collected dog fouling data was comprehensive and covered the entire country.
2) The FOI included the following questions:
Number of dog fouling complaints recorded each year between 01-01-2015 and 31-12-2022
Number of Fixed Penalty Notices issued for dog fouling each year between 01-01-2015 and 31-12-2022
Number of prosecutions (successful or otherwise) for dog fouling each year between 01-01-2015 and 31-12-2022
Does the local authority have campaigns in place to reduce and/or prevent dog fouling? If “yes,” what are these campaigns? This can include but is not limited to:
How many dog waste bins are available in the local authority area?
Does the local authority have free dog waste bag dispensers? If yes, how many? And if the local authority has previously, when were they stopped?
Are there any Public Space Protection Orders in place throughout the local authority?
3) By looking at the number of FPNs and prosecutions related to dog fouling in each area, this report can help to determine whether the councils are taking appropriate action to reduce and prevent dog fouling. The councils were also asked to outline any ongoing campaigns to raise awareness on the issue of dog fouling in the local communities that were in place.
This report has been created to address the national issue of dog fouling, highlighting which areas of the country are worst affected and encouraging more action against this environmental problem, which can pose health risks.
Results
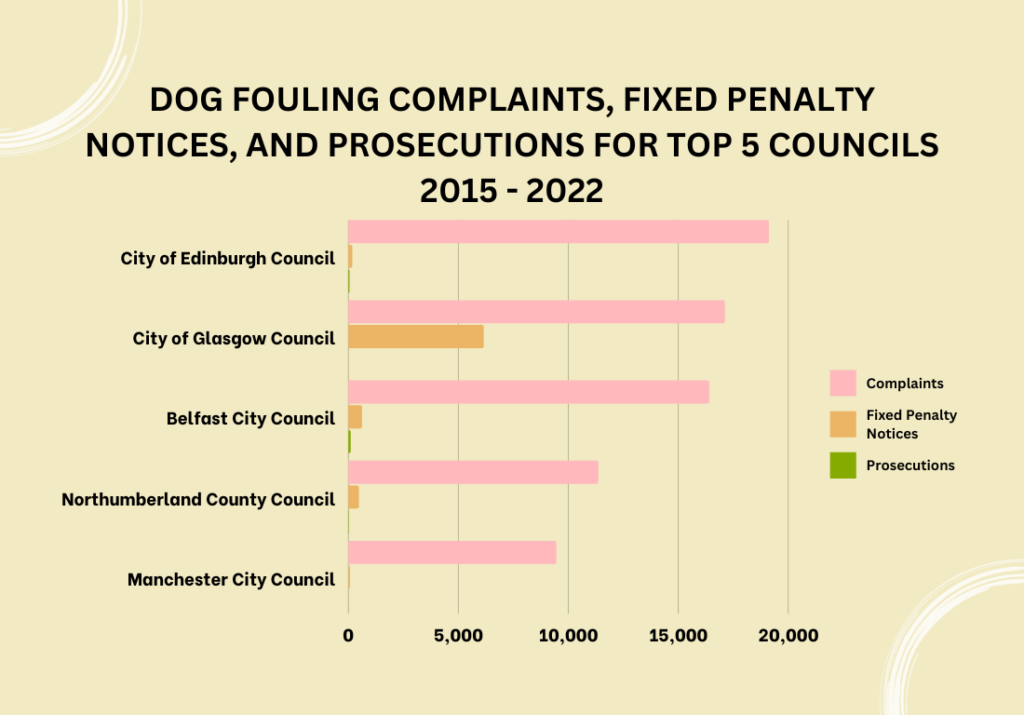
The findings have been split up to show the number of dog fouling complaints, FPNs, and prosections from the 1st of January 2015 to the 31st of December 2022.
Number of Dog Fouling Complaints
| Council | 2015 | 2016 | 2017 | 2018 | 2019 | 2020 | 2021 | 2022 |
|---|---|---|---|---|---|---|---|---|
| Barnet Council* | No data | No data | 2.5 | 2.5 | 2.5 | 2.5 | 2.5 | 2.5 |
| Belfast City Council | 1,886 | 2,552 | 2,455 | 2,138 | 2,077 | 1,625 | 1,582 | 2,071 |
| Birmingham City Council | 810 | 761 | 764 | 727 | 523 | 458 | 617 | 599 |
| Bolton Council | 150 | 151 | 97 | 104 | 101 | 60 | 50 | 94 |
| Bournemouth, Christchurch and Poole Council | No data | 64 | 46 | 28 | 56 | 36 | 84 | 58 |
| Bradford City Council | 538 | 445 | 451 | 442 | 434 | 403 | 350 | No data |
| Brent Council | No data given | No data given | No data given | No data given | No data given | No data given | 17 | 38 |
| Bristol City Council* | 181.6 | 181.6 | 181.6 | 181.6 | 181.6 | 181.6 | 181.6 | 181.6 |
| Bromley Council | 147 | 148 | 92 | 84 | 76 | 65 | 82 | 86 |
| Buckinghamshire Council** | N/A | N/A | N/A | N/A | N/A | N/A | N/A | N/A |
| Cardiff Council | 3 | 5 | 0 | 4 | 3 | 3 | 1 | 1 |
| Central Bedfordshire Council | 333 | 286 | 214 | 157 | 233 | 122 | 100 | 173 |
| Cheshire East Council | No data | No data | 0 | 5 | 5 | 1 | 4 | 7 |
| Cheshire West and Chester Council | No data | No data | No data | 692 | 684 | 654 | 647 | 647 |
| City of Doncaster Council | 944 | 1,021 | 1,020 | 674 | 613 | 470 | 419 | 451 |
| City of Edinburgh Council | 3,647 | 2,931 | 2,679 | 2,923 | 2,259 | 1,494 | 1,523 | 1,642 |
| City of Glasgow Council | 1,605 | 1,762 | 2,260 | 3,062 | 2,881 | 1,916 | 1,806 | 1,784 |
| Cornwall Council | 501 | 802 | 784 | 659 | 694 | 770 | 521 | 329 |
| Coventry City Council | 271 | 611 | 598 | 319 | 432 | 404 | 409 | 335 |
| Croydon Council | No data | No data | No data | No data | 87 | 26 | 29 | 19 |
| Dorset Council* | 155.5 | 155.5 | 155.5 | 155.5 | 155.5 | 155.5 | 155.5 | 155.5 |
| Dudley Council | 50 | 89 | 118 | 110 | 102 | 74 | 76 | 70 |
| Durham County Council | No data | 242 (records started mid-July) | 852 | 669 | 530 | 560 | 603 | 587 |
| Ealing Council*** | N/A | N/A | N/A | N/A | N/A | N/A | N/A | N/A |
| East Riding of Yorkshire Council | 609 | 482 | 436 | 571 | 528 | 384 | 389 | 365 |
| Hillingdon Council | 526 | 575 | 518 | 610 | 475 | 536 | 364 | 232 |
| Kirklees Council | 335 | 426 | 274 | 133 | 105 | 115 | 120 | 112 |
| Lambeth Council** | N/A | N/A | N/A | N/A | N/A | N/A | N/A | N/A |
| Leeds City Council | 1,162 | 1,100 | 1,037 | 856 | 803 | 675 | 606 | 672 |
| Leicester City Council | 30 | 206 | 131 | 77 | 69 | 62 | 115 | 167 |
| Lewisham Council | 14 | 3 | 4 | 7 | 4 | 2 | 12 | 11 |
| Liverpool City Council* | 5.9 | 5.9 | 5.9 | 5.9 | 5.9 | 5.9 | 5.9 | 5.9 |
| Manchester City Council | 1,196 | 1,434 | 1,302 | 1,118 | 1,284 | 995 | 1,141 | 948 |
| Newcastle City Council | 268 | 250 | 194 | 203 | 150 | 117 | 97 | 149 |
| Newham Council | 20 | 11 | 7 | 8 | 24 | 7 | 18 | 56 |
| Northumberland County Council | 1,790 | 1,855 | 1,535 | 1,447 | 1,427 | 1,317 | 1,122 | 851 |
| Nottingham City Council | No data | No data | 38 | 78 | 475 | 1,031 | 1,200 | 1,107 |
| Redbridge Council | 629 | 639 | 686 | 708 | 624 | 705 | 767 | 775 |
| Sandwell Council | No data | 677 (system introduced Feb 2016) | 1,035 | 1,069 | 1,163 | 1,088 | 1,225 | 1,287 |
| Sheffield City Council | 584 | 769 | 636 | 429 | 329 | 240 | 193 | 156 |
| Shropshire Council | 204 (partial year) | 508 | 521 | 483 | 307 | 323 | 313 | 288 |
| South Gloucestershire Council | No data | No data | No data | 198 | 228 | 247 | 184 | 196 |
| Southwark Council** | N/A | N/A | N/A | N/A | N/A | N/A | N/A | N/A |
| Stockport Council | 364 | 282 | 236 | 278 | 220 | 264 | 249 | 224 |
| Tower Hamlets Council | No data | No data | No data | No data | No data | 113 | 206 | 146 |
| Wakefield Council | 762 | 856 | 655 | 975 | 635 | 476 | 380 | 576 |
| Wandsworth Council | 0 | 0 | 3 | 206 | 175 | 248 | 170 | 139 |
| Wigan Council | 1,118 | 1,161 | 1,090 | 1,171 | 899 | 825 | 533 | 946 |
| Wiltshire Council | 239 | 181 | 129 | 85 | 120 | 125 | 209 | 117 |
| Wirral Council | No data | No data | No data | 138 | 532 | 522 | 1,002 | 504 |
* The councils provided a total sum for the specified years, so an average number of dog fouling complaints has been calculated for each year.
** These councils did not provide the requested data for the specified years.
*** This council did not have the data available in a reportable format.
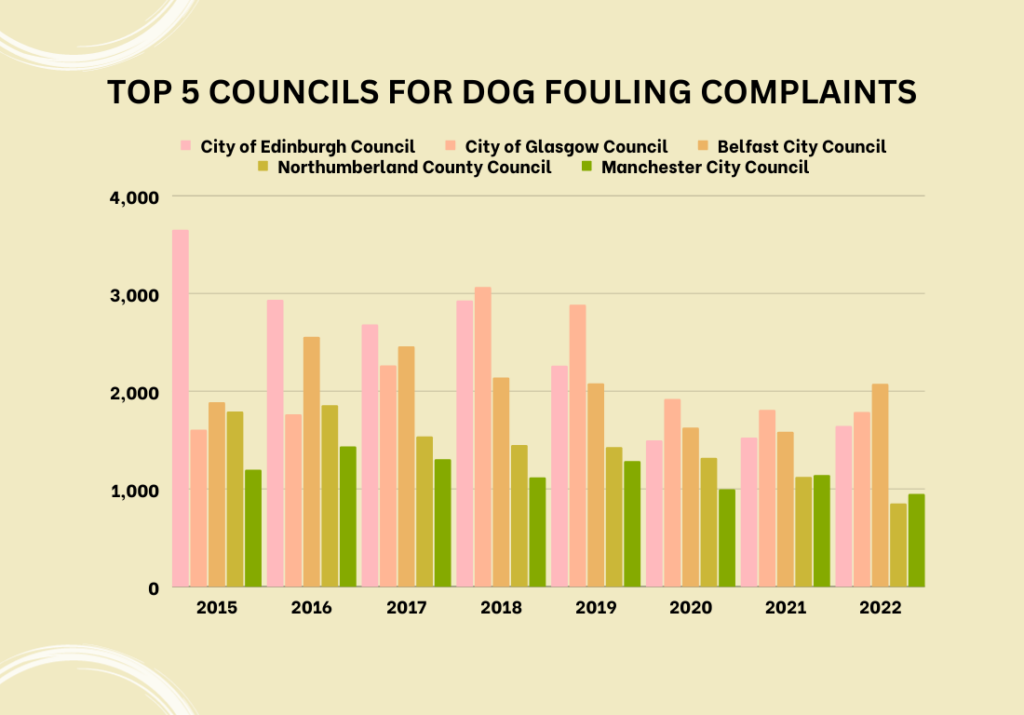
The council with the most dog fouling complaints between 2015 and 2022 is City of Edinburgh Council, with a total of 19,098 complaints; this consists of 14,707 complaints made to its Street Cleaning service and 4,391 to the Environmental Warden. This was considerably more than the council to receive the lowest number of complaints between 2015 and 2022, Cardiff Council, which only recorded 20 complaints.
Second was City of Glasgow Council, with 17,076 dog fouling complaints. The highest number of complaints was recorded in 2018 at 23,645, and Glasgow received 3,062 complaints that year.
Belfast City Council had 16,386 complaints from 2015 to 2022, making it the third most complained to council in the UK.
Fourth was Northumberland County Council, which received 11,344 complaints regarding dog fouling.
Manchester City Council came fifth, with 9,418 complaints.
However, the dog fouling complaints received by UK councils were the lowest in 2022; there were only 19,056 complaints recorded that year.
Number of Dog Fouling Fixed Penalty Notices
| Council | 2015 | 2016 | 2017 | 2018 | 2019 | 2020 | 2021 | 2022 |
|---|---|---|---|---|---|---|---|---|
| Barnet Council | 0 | 0 | 0 | 0 | 0 | 0 | 0 | 0 |
| Belfast City Council | 152 | 125 | 117 | 75 | 73 | 43 | 18 | 15 |
| Birmingham City Council | 21 | 18 | 13 | 5 | 4 | 2 | 2 | 4 |
| Bolton Council | 12 | 10 | 4 | 7 | 6 | 2 | 2 | 9 |
| Bournemouth, Christchurch and Poole Council | 0 | 0 | 0 | 0 | 0 | 0 | 0 | 0 |
| Bradford City Council | 12 | 9 | 7 | 4 | 9 | 3 | 7 | 5 |
| Brent Council | 0 | 0 | 0 | 0 | 0 | 0 | 2 | 1 |
| Bristol City Council* | 1.4 | 1.4 | 1.4 | 1.4 | 1.4 | 1.4 | 1.4 | 1.4 |
| Bromley Council | 4 | 7 | 1 | 3 | 1 | 1 | 0 | 1 |
| Buckinghamshire Council | No data given | No data given | No data given | No data given | No data given | 0 | 0 | 0 |
| Cardiff Council | No data | No data | No data | 1 | 0 | 0 | 1 | 3 |
| Central Bedfordshire Council | No data | No data | No data | 4 | 7 | 0 | 6 | No data |
| Cheshire East Council | 4 | 12 | 4 | 65 | 71 | 4 | 6 | 10 |
| Cheshire West and Chester Council | No data | No data | No data | 0 | 0 | 1 | 2 | 1 |
| City of Doncaster Council | No data | No data | No data | 61 | 14 | 22 | 12 | 10 |
| City of Edinburgh Council | 68 | 53 | 13 | 19 | 19 | 1 | 5 | 1 |
| City of Glasgow Council | 1,862 | 1,516 | 1,058 | 794 | 568 | 116 | 27 | 199 |
| Cornwall Council | 28 | 21 | 24 | 3 | 8 | 12 | 29 | 13 |
| Coventry City Council | 0 | 17 | 22 | 19 | 15 | 15 | 16 | 11 |
| Croydon Council | 4 | 0 | 0 | 3 | 1 | 1 | 1 | 0 |
| Dorset Council | 0 | 0 | 0 | 0 | 0 | 0 | 0 | 0 |
| Dudley Council | 14 | 26 | 9 | 14 | 25 | 8 | 19 | 15 |
| Durham County Council | No data | 15 (from mid-July) | 40 | 35 | 16 | 17 | 10 | 27 |
| Ealing Council | 0 | 3 | 2 | 0 | 6 | 8 | 4 | 4 |
| East Riding of Yorkshire Council | 12 | 24 | 27 | 2 | 3 | 1 | 1 | 1 |
| Hillingdon Council | 0 | 0 | 0 | 0 | 0 | 1 | 0 | 0 |
| Kirklees Council | 19 | 6 | 2 | 4 | 1 | 0 | 14 | 12 |
| Lambeth Council | 0 | 0 | 0 | 0 | 0 | 1 | 3 | No data |
| Leeds City Council | 28 | 30 | 19 | 13 | 17 | 13 | 9 | 12 |
| Leicester City Council | No data | No data | No data | 8 | 4 | 1 | 1 | 8 |
| Lewisham Council | 0 | 0 | 0 | 0 | 0 | 0 | 0 | 0 |
| Liverpool City Council* | 6 | 6 | 6 | 6 | 6 | 6 | 6 | 6 |
| Manchester City Council | 0 | 2 | 1 | 7 | 7 | 37 | 6 | 8 |
| Newcastle City Council | 3 | 1 | 0 | 1 | 0 | 0 | 0 | 0 |
| Newham Council | 8 | 1 | 4 | 0 | 2 | 1 | 0 | 2 |
| Northumberland County Council | 111 | 100 | 76 | 92 | 59 | 11 | 19 | 8 |
| Nottingham City Council | 47 | 37 | 5 | 3 | 0 | 0 | 0 | 21 |
| Redbridge Council | No data | No data | No data | No data | No data | 1 | 1 | 1 |
| Sandwell Council | 69 | 63 | 38 | 11 | 2 | 2 | 2 | 2 |
| Sheffield City Council | 2 | 2 | 6 | 0 | 9 | 4 | 6 | 0 |
| Shropshire Council | 4 | 2 | 2 | 1 | 0 | 0 | 0 | 0 |
| South Gloucestershire Council | No data | No data | No data | 4 | 2 | 0 | 0 | 3 |
| Southwark Council | 37 | 20 | No data | 8 | 9 | No data | 1 | 0 |
| Stockport Council | 0 | 0 | 0 | 0 | 2 | 1 | 3 | 3 |
| Tower Hamlets Council | 32 | 2 | 1 | 0 | 0 | 1 | 3 | 0 |
| Wakefield Council | 15 | 24 | 18 | 13 | 8 | 0 | 3 | 11 |
| Wandsworth Council | 1 | 4 | 4 | 0 | 0 | 0 | 1 | 3 |
| Wigan Council | 98 | 39 | 8 | 6 | 4 | 5 | 0 | 0 |
| Wiltshire Council | 0 | 0 | 0 | 0 | 0 | 0 | 0 | 0 |
| Wirral Council | No data | 84 | 192 | 112 | 10 | 0 | 0 | 0 |
* The councils provided a total sum for the specified years, so an average number of dog fouling FPNs has been calculated for each year.
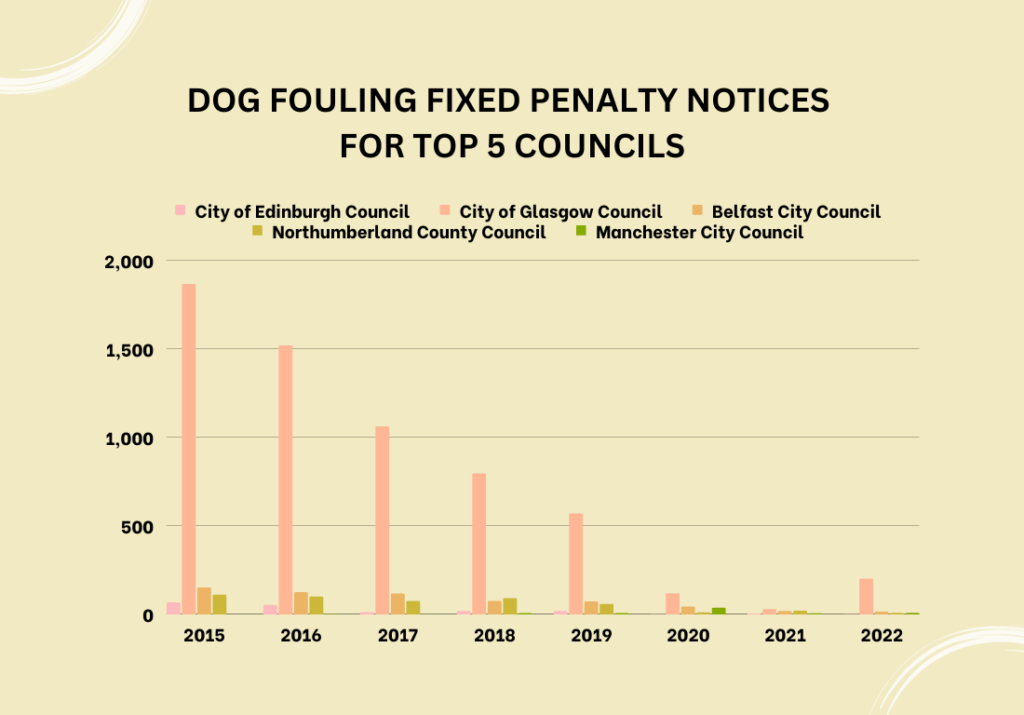
City of Glasgow Council issued the most Fixed Penalty Notices (FPNs); 6,140 FPNs were sent out from 2015 to 2022. Assuming all fines were paid within 28 days at £80, the council could have received up to £491,200 in eight years.
Belfast City Council sent out the second-highest number of fines at 618 FPNs, then Northumberland County Council was third with 476.
Despite having the highest number of complaints, City of Edinburgh Council only issued 179 FPNs from 2015 to 2022.
The number of FPNs issued to dog fouling offenders appears to have fallen considerably since 2015. There were 2,668 fines sent out in 2015, but this dropped to only 242 in 2021.
Number of Dog Fouling Prosecutions
| Council | 2015 | 2016 | 2017 | 2018 | 2019 | 2020 | 2021 | 2022 |
|---|---|---|---|---|---|---|---|---|
| Barnet Council | 0 | 0 | 0 | 0 | 0 | 0 | 0 | 0 |
| Belfast City Council | 26 | 32 | 19 | 15 | 8 | 1 | 2 | 2 |
| Birmingham City Council | 7 | 6 | 2 | 0 | 1 | 0 | 2 | 3 |
| Bolton Council | 1 | 1 | 1 | 2 | 0 | 0 | 0 | 1 |
| Bournemouth, Christchurch and Poole Council | 0 | 0 | 0 | 0 | 0 | 0 | 0 | 0 |
| Bradford City Council | 0 | 2 | 0 | 0 | 0 | 0 | 0 | 0 |
| Brent Council | 0 | 0 | 0 | 0 | 0 | 0 | 0 | 0 |
| Bristol City Council | 0 | 0 | 0 | 0 | 0 | 0 | 0 | 0 |
| Bromley Council | 0 | 0 | 0 | 0 | 0 | 0 | 0 | 0 |
| Buckinghamshire Council | No data given | No data given | No data given | No data given | No data given | 0 | 0 | 0 |
| Cardiff Council | 5 prosecutions since 2015 | |||||||
| Central Bedfordshire Council | 0 | 1 | 0 | 0 | 0 | 0 | 0 | 0 |
| Cheshire East Council | Less than 5 prosecutions since 2015 | |||||||
| Cheshire West and Chester Council | No data | No data | No data | 0 | 0 | 1 | 2 | 0 |
| City of Doncaster Council | No data | No data | No data | Data was not given | 0 | 0 | Data was not given | Data was not given |
| City of Edinburgh Council | 21 | 20 | 4 | 7 | 0 | 0 | 0 | 0 |
| City of Glasgow Council* | N/A | N/A | N/A | N/A | N/A | N/A | N/A | N/A |
| Cornwall Council | No data | No data | No data | No data | No data | No data | No data | 1 |
| Coventry City Council | 0 | 0 | 3 | 0 | 0 | 1 | 2 | 1 |
| Croydon Council | 0 | 0 | 0 | 0 | 0 | 0 | 0 | 0 |
| Dorset Council | 0 | 0 | 0 | 0 | 0 | 0 | 0 | 0 |
| Dudley Council | No data | No data | No data | 1 | 0 | 0 | 0 | 0 |
| Durham County Council | No data | 0 | 13 | 1 | 17 | 5 | 2 | 25 |
| Ealing Council | 0 | 0 | 0 | 0 | 0 | 0 | 0 | 0 |
| East Riding of Yorkshire Council | 0 | 3 | 3 | 0 | 0 | 0 | 0 | 0 |
| Hillingdon Council | 0 | 0 | 0 | 0 | 0 | 0 | 0 | 0 |
| Kirklees Council | 0 | 0 | 0 | 0 | 0 | 0 | 0 | 0 |
| Lambeth Council | 0 | 0 | 0 | 0 | 0 | 0 | 0 | 0 |
| Leeds City Council | 3 | 3 | 2 | 1 | 2 | 0 | 0 | 0 |
| Leicester City Council | No data | No data | No data | 0 | 0 | 0 | 0 | 0 |
| Lewisham Council | 0 | 0 | 0 | 0 | 0 | 0 | 0 | 0 |
| Liverpool City Council* | N/A | N/A | N/A | N/A | N/A | N/A | N/A | N/A |
| Manchester City Council | 0 | 0 | 0 | 0 | 2 | 0 | 0 | 0 |
| Newcastle City Council | 8 | 9 | 6 | 3 | 4 | 0 | 0 | 0 |
| Newham Council | 0 | 0 | 0 | 0 | 0 | 0 | 0 | 0 |
| Northumberland County Council | 4 | 5 | 2 | 2 | 2 | 1 | 1 | 1 |
| Nottingham City Council | 2 | 0 | 0 | 0 | 0 | 0 | 0 | 0 |
| Redbridge Council | 0 | 0 | 0 | 0 | 0 | 0 | 0 | 0 |
| Sandwell Council | 0 | 0 | 0 | 0 | 0 | 0 | 0 | 0 |
| Sheffield City Council | 0 | 1 | 1 | 0 | 3 | 2 | 0 | 0 |
| Shropshire Council | 1 | 0 | 0 | 0 | 0 | 0 | 0 | 0 |
| South Gloucestershire Council | 0 | 0 | 0 | 0 | 0 | 0 | 0 | 0 |
| Southwark Council | 0 | 0 | 0 | 0 | 0 | 0 | 0 | 0 |
| Stockport Council | 0 | 0 | 0 | 0 | 2 | 1 | 3 | 2 |
| Tower Hamlets Council | 0 | 0 | 0 | 0 | 0 | 0 | 0 | 0 |
| Wakefield Council | 0 | 1 | 1 | 3 | 1 | 0 | 0 | 2 |
| Wandsworth Council | 15 | 29 | 19 | 2 | 7 | 5 | 2 | 16 |
| Wigan Council | 11 | 2 | 0 | 0 | 0 | 0 | 0 | 0 |
| Wiltshire Council | 0 | 0 | 0 | 0 | 0 | 0 | 0 | 0 |
| Wirral Council | No data | 0 | 36 | 5 | 0 | 0 | 0 | 0 |
* These councils do not hold this information.
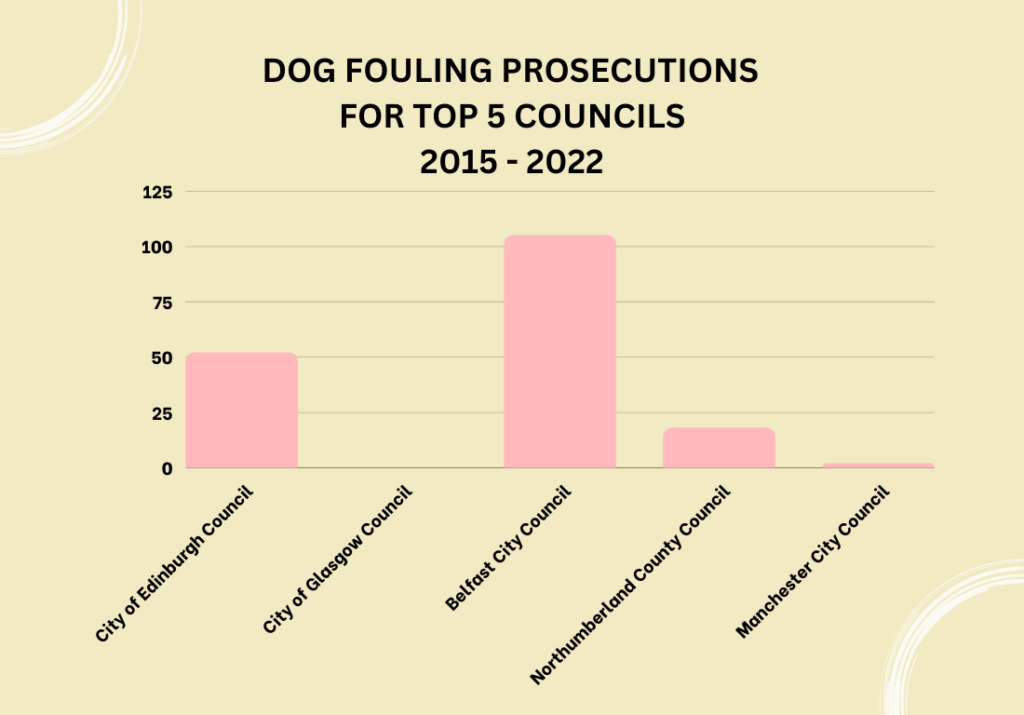
Out of the 50 councils contacted, Belfast City Council had the most prosecutions related to dog fouling offenses; there were 105 prosecutions from 2015 to 2022.
The council with the second-highest number of prosecutions for dog fouling was Wandsworth, which had 95 prosecutions. A total of 63 prosecutions from Durham County Council meant this local authority followed in third.
Prosecuting dog fouling offenders is not as common as FPNs; 2016 was the year with the most prosecutions for dog fouling at 115, while there were only 12 prosecutions in 2020.
Anti-Dog Fouling Campaigns
Most councils utilise signs and temporary pavement stencils in “hot spot” areas for dog fouling. However, some councils have developed different methods to reduce dog fouling, such as South Gloucestershire, which carries out dog fouling enforcement to patrol affected areas and respond to reports from the local community. Several councils also have free dog waste bag dispensers, although many local authorities have scrapped this method due to the dispensers being vandalised or too costly to refill.
The London Borough of Redbridge has a unique method of catching dog fouling offenders red-handed. This council launched the “Proud of Pick Up” campaign, which resulted in over 200 board posters and signs displayed in areas where dog fouling is prevalent. At the beginning of 2023, Redbridge Council also introduced the use of specialist cameras. Footage from these cameras is often shared on Redbridge’s Wall of Shame webpage to encourage residents to contact the council if they recognise an offender.
Final Words
Although not all UK councils were included in this FOI request, the data does highlight dog fouling continues to be a nationwide issue.
It is important to remember that not only is dog fouling a health risk, but cleaning up after a pet dog is a crucial aspect of being a responsible owner. It is also essential to keep the environment healthy and thriving.
Requests for Full Data
We are willing to share the raw data with interested parties; however, this is only by request. If you want to receive the raw data, please email [email protected] to enquire, and we will get back to you.